DATA
ANALYSIS & VISUALIZATION
Includes journalistic reporting, statistical analysis, and other research projects.
Regression Analysis: Is D.C.'s Citizen-Based Violence Intervention Program Lowering Violent Crime?
April 15, 2022
Results of a multivariate regression analysis conducted across neighborhoods with and without violence interrupters (fixed effects), using incident rate ratio to measure frequency of various violent crime in Washington, D.C.
.png)
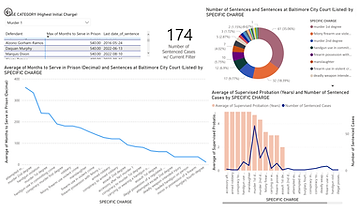
PowerBI Dashboard Prototype: Sentences for Homicide Defendants in Baltimore City by Charge
Oct. 27, 2022
The below diagram, constructed in PowerBI, summarizes the sentences portion of a large criminal justice database, depicting sentences by individual charge. Interactive users would be able to change filters on all live charts for their own analyze, as well as observe individual sentences. Data from Baltimore Witness.
Ages of Homicide and Shooting Victims in Washington, D.C. - Comparing Two Months
Feb. 11, 2022
The below chart, generated using Python, depicts the age distribution of Washington, D.C. non-fatal shooting and homicide victims in Dec. 2021 compared to Jan. 2022. Data from D.C. Witness.
.png)
Airtable Dashboard Prototype - Gun Confiscation in Washington, D.C.
Oct. 31, 2022
The below dashboard is an overview of a large database housed in Airtable. Data self-collected through journalistic reporting of MPD gun confiscation press releases.

Misdemeanor Domestic Violence Sentences in Washington, D.C.
Jan. 3, 2022
The below bar chart is a rare study of misdemeanor sentences, ultimately illustrating how little prison time misdemeanor defendants are actually required to serve. Data self-collected from reporting on D.C. misdemeanor cases.
.png)
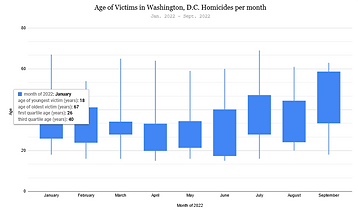
Victim Age Analysis - Washington, D.C. Homicides
Oct. 4, 2022
The below box chart, generated using Google, illustrates age ranges of homicide victims in Washington, D.C. per month for the period of Jan. - Sept. 2022. Data from D.C. Witness.
.png)
Comparing D.C.'s Citywide Homicide Count Across Eight Years
July 13, 2022
The below line chart, generated in Google, compares the annual city-wide homicide trend across 8 years. Data from Open Data DC.
.png)
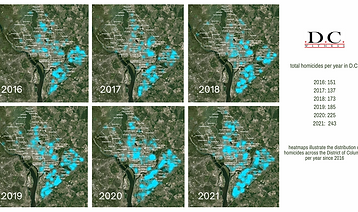
Heatmap: Comparing Homicides in D.C. Across 6 Years, 2016 - 2021
May 23, 2022
The below heatmap, generated using the Mapbox API, illustrates concentrations of homicides in Washington, D.C. The graphic was used as part of a study and presentation on the city's crime wave during the pandemic. Data from Open Data DC.
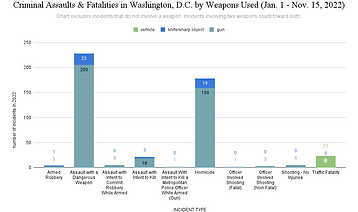
Weapons and Methods Used in Washington, D.C. Violence, Jan. 1 - Nov. 15, 2022
Nov. 16, 2022
The below bar chart illustrates methods of violence in Washington, D.C. violent crime and all deaths, including vehicular.
Violence Interrupter Regression Results
June 27, 2022
Box graphic depicting the results in Regression Analysis: Is D.C.'s Citizen-Based Violence Intervention Program Lowering Violent Crime?
.png)
Crime Incidents Cluster Map - Baltimore City, June - Oct. 2022
Oct. 17, 2022
The following Datawrapper visualization illustrates a cluster map of homicides and non-fatal shootings in Baltimore. Interactive users were able to hover for details on individual incidents. Data from Baltimore FOIA.

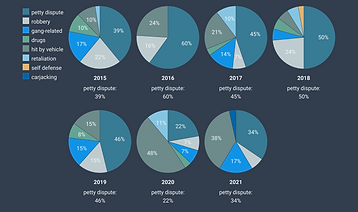
Motives for Homicides in Washington, D.C. Across Seven Years
Jan. 21, 2022
The below diagram, generated using Datawrapper, uses multiple pie charts to compare motivations for homicides that occurred in Washington, D.C. from 2015 - 2021. Data from D.C. Witness
.png)
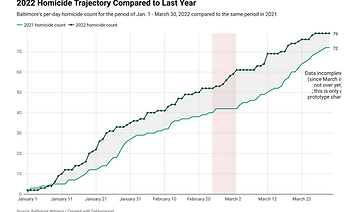
Pandemic Period Difference, 2021 vs. 2022: Homicides in Baltimore City
March 28, 2022
Year-to-year trend line analysis of violent crime in Baltimore City, showing the early effects of the 2021 Covid-19 pandemic.
.png)
GIS Diagram - Location of D.C. Violence Interrupter Organizations
May 4, 2022
The following GIS visualization, designed using MapBox API, maps out locations of city violence interrupters in D.C., including the non-profit organizations that run them. KML files provided directly by DC city government. Specific details from organization reporting on violence interrupter organizations and sites.

Guns Confiscated by the Metropolitan Police Department - Aug. 2022
Sept. 27, 2022
The below cluster chart, generated using Datawrapper, shows types of guns confiscated by the D.C. police department (MPD) in Aug. 2022. Interactive users would have popup-on-hover details regarding individual seizures. Data was self-collected from MPD press releases.

Heatmap: Homicides in Baltimore, Jan. 1 - May 15, 2022
June 16, 2022
The below heatmap, generated using the Mapbox API, illustrates concentrations of deadly violence in Baltimore City. The graphic was used as part of a study and presentation on the city's crime wave during the pandemic. Data from Baltimore Witness.
.png)
Blueprint: Proposal for New Way of Reporting Weekly Shootings in Baltimore
Nov. 9, 2021
The below map was generated using Mapbox API and was ultimately rejected as a proposal. Interactive users would have been able to adjust the map and hover on locations with pop-up details. Data from Baltimore Witness.
.png)